Simple And Effective
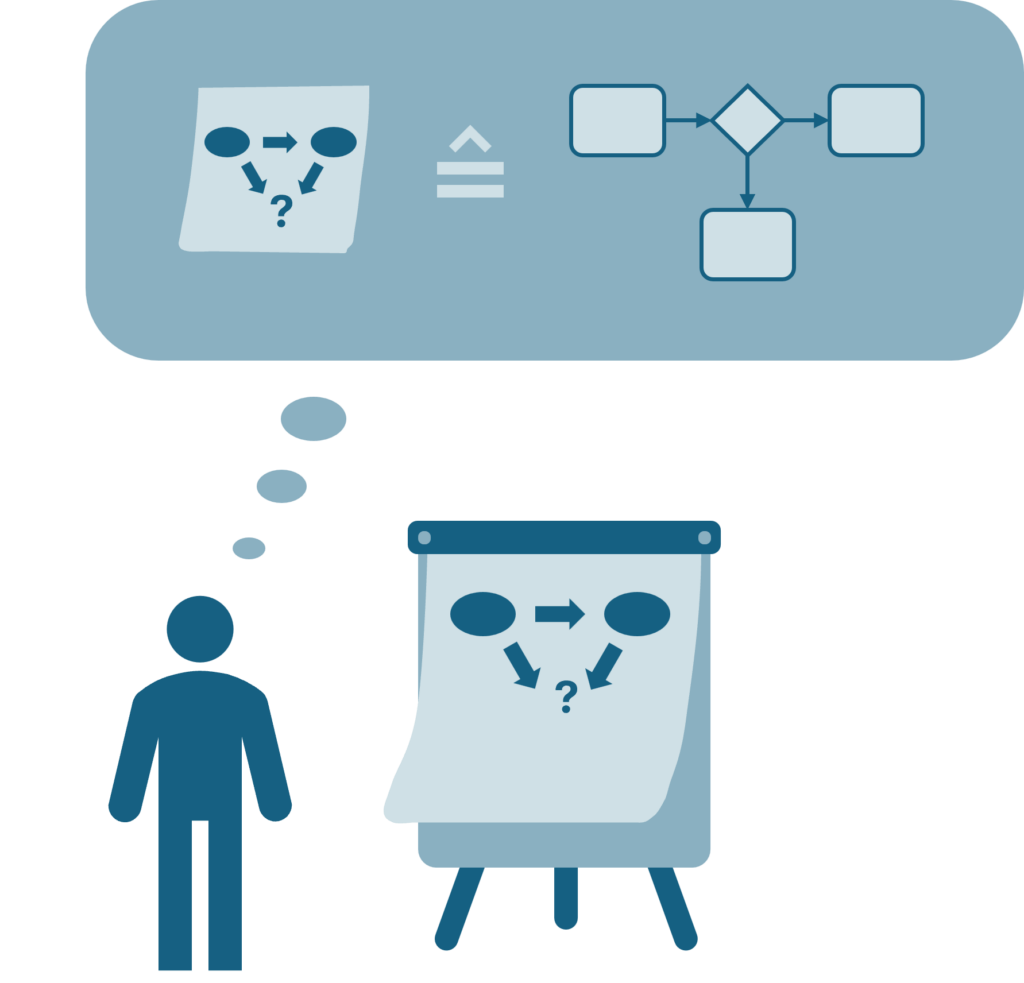
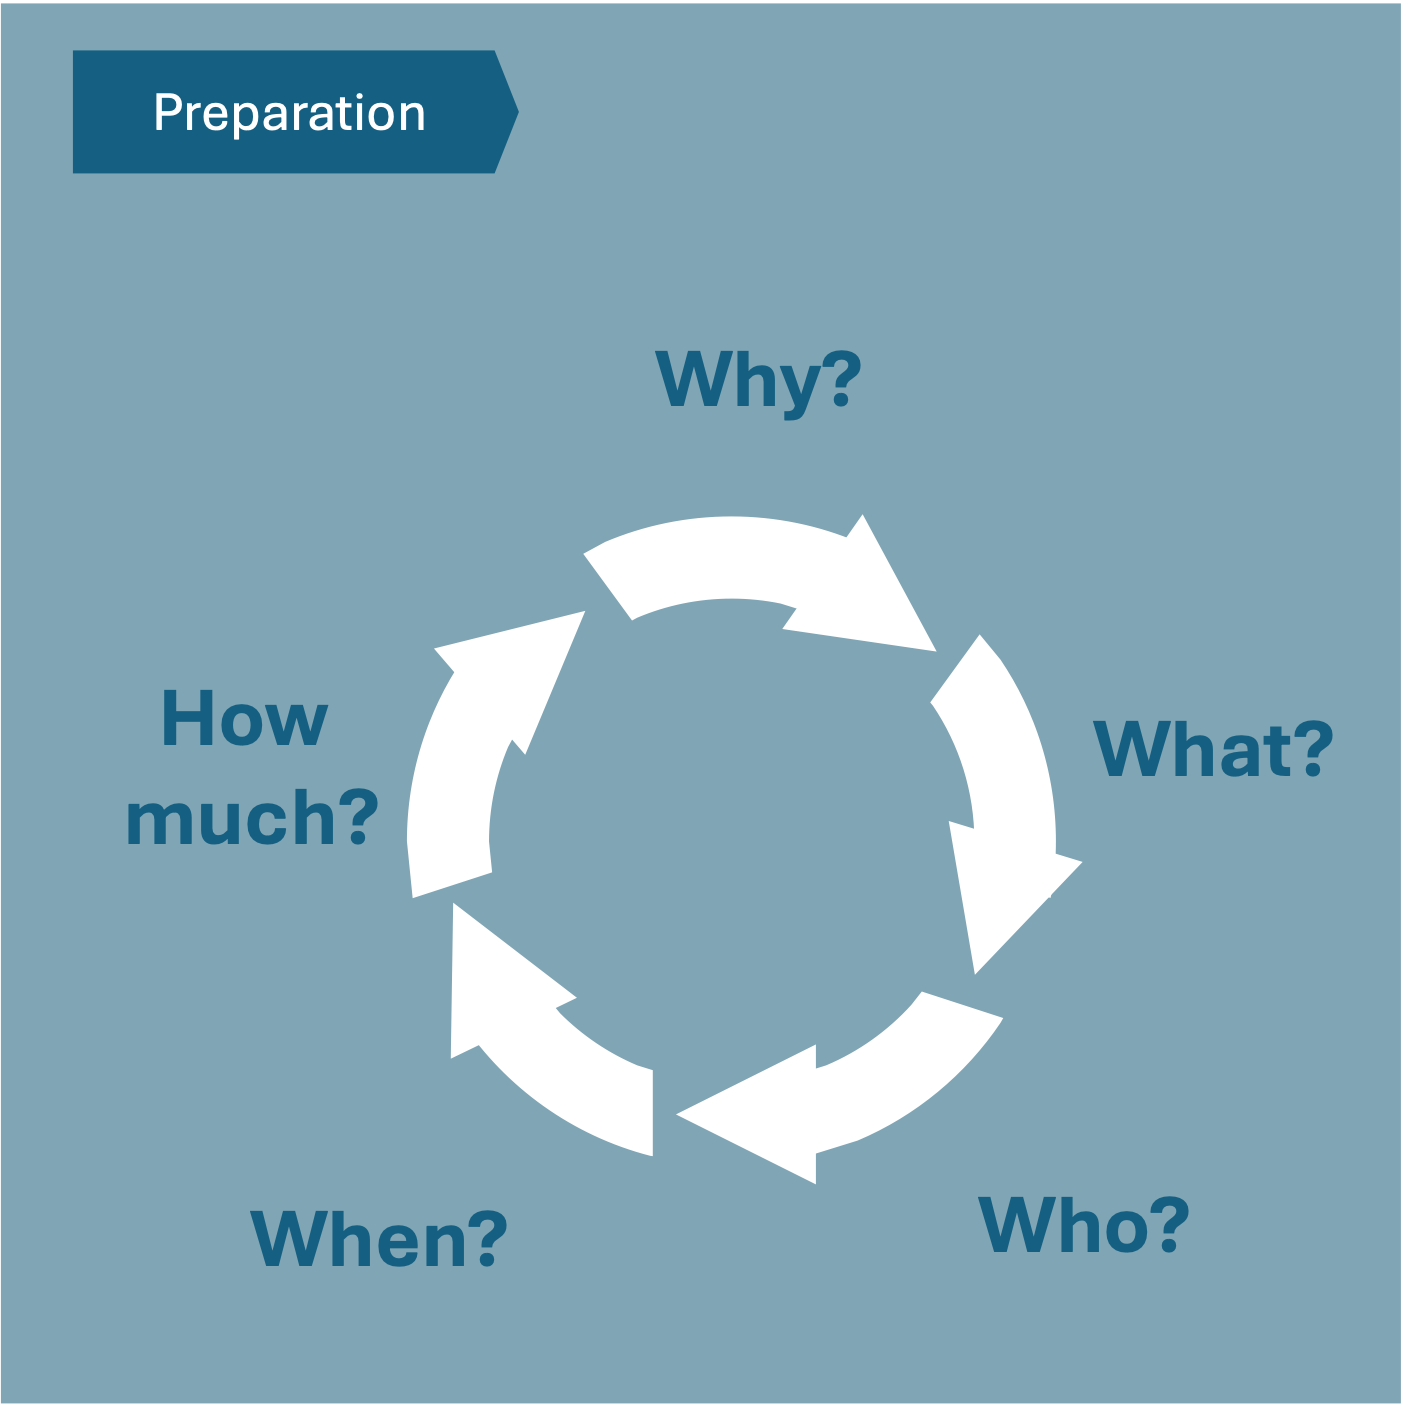
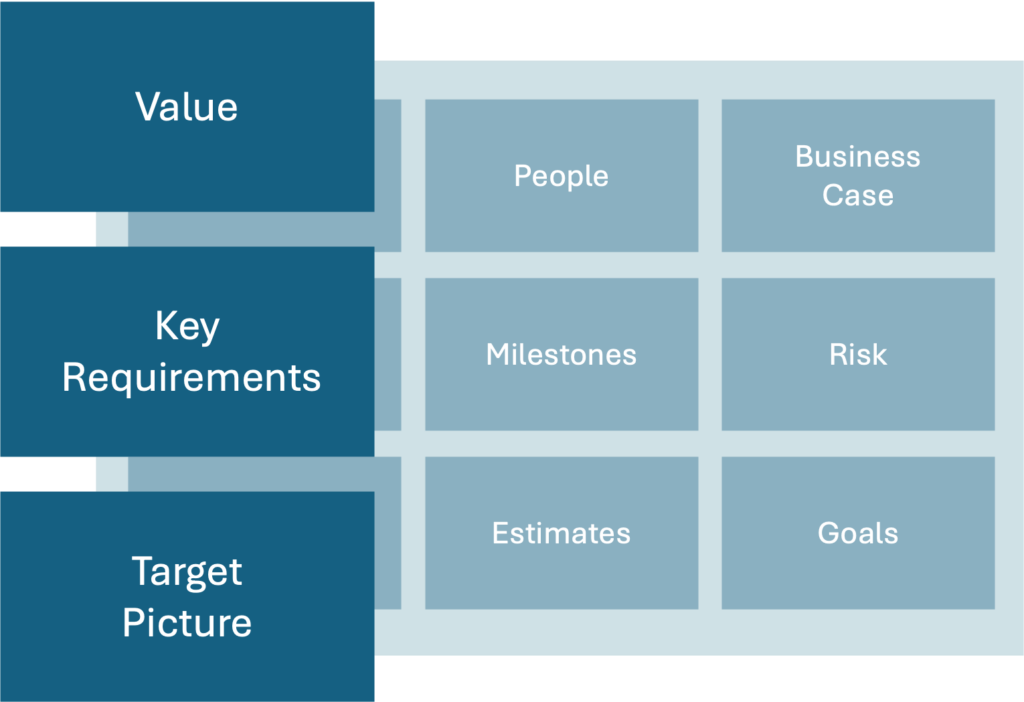
“Flipchart Modelling” is a simple, light-weight method to shape the deliverables of an initiative in the Preparation Phase. This includes the value to the customer or user, the key requirements, such as legal obligations that need to be met, and a target picture from both a business and technical perspective.
“Flipchart Modelling” Is Made To Facilitate Stakeholder Involvement
Flipchart modelling is optimal if you need quick results in sketching out the high-level scope and if you want to include many different stakeholders in your analysis with different backgrounds.
The name comes from the fact that it can be done literally on a flipchart or equally simple tools such as PowerPoint or Miro.
The notation can be used in interview sessions or alignment meeting to communicate or discuss the initiative. Work with simple charts with seven or less elements per chart.
Note that only a general overview is required in the preparation phase. Details will be worked out later in the individual delivery teams.

Decomposition Methodology On Four Levels
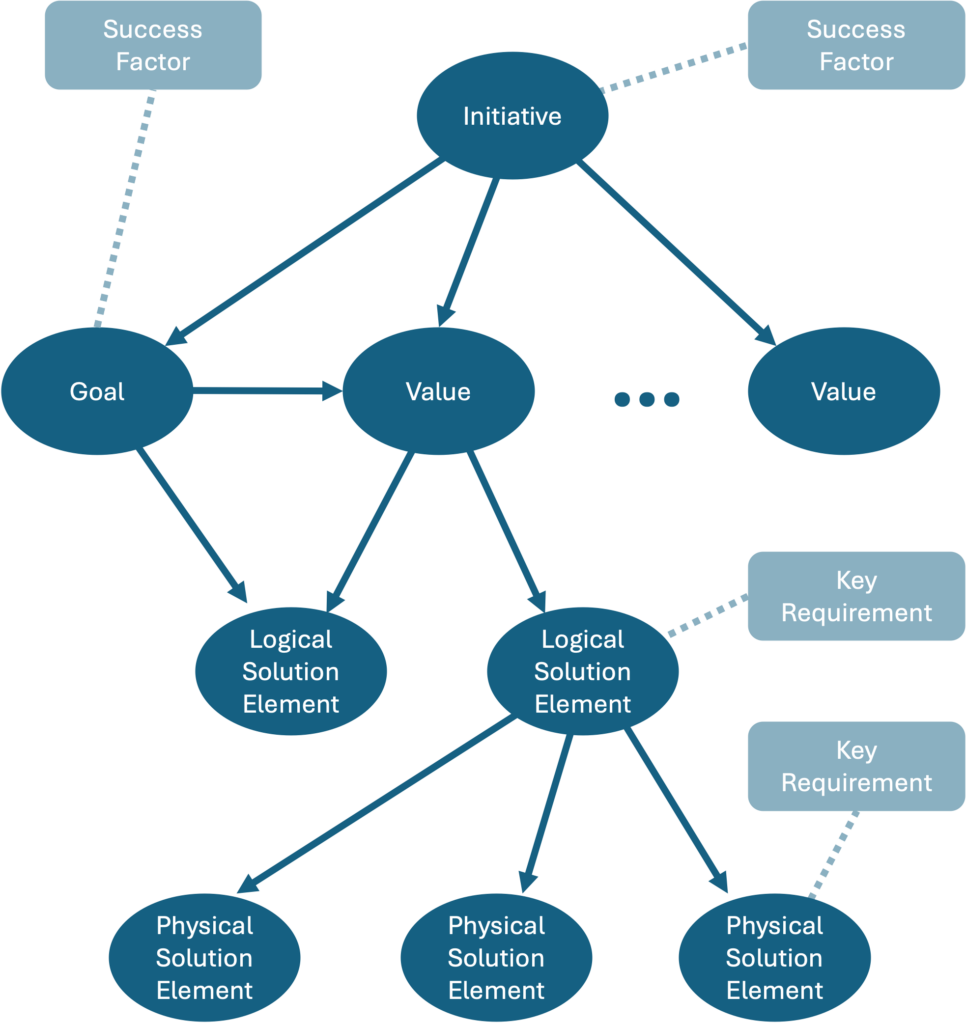
We recommend describing the deliverable in the IOM initially on four levels.
On the first level there is the “home node” of the initiative with associated success factors. On the second level we assign desired goals and values to the initiative. On the third level we associate logical solution elements to the desired values. Finally, on the fourth level you assign physical solution elements to the logical ones.
Example
Initiative: Increase market share
Value: Increased digital customer intimacy
Logical solution element: Online self-service
Physical solution element: Application xyz
How exactly the levels are modelled depends on the preferences and skills of the organizations – for example, in a company with a mature process management the logical solution elements may be sub-processes, in other companiescapabilities are the better choice (see Initiative Overview Map).
Base For Walkthroughs
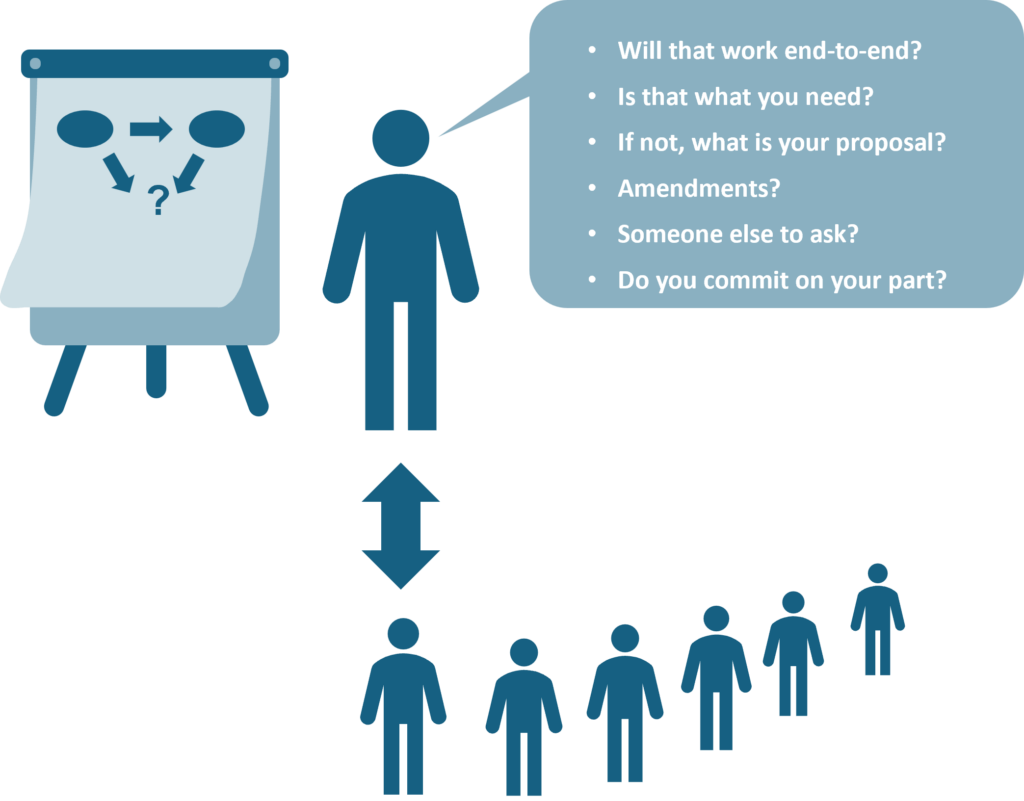
You can use the flipchart model as the base for repetitive walkthroughs with the VEC (VEO Coordination Meeting) and other stakeholders.
Improve the flipchart model step by step and repeat the walkthroughs until all participants are aligned.
Rigidity Can Be Increased Step By Step
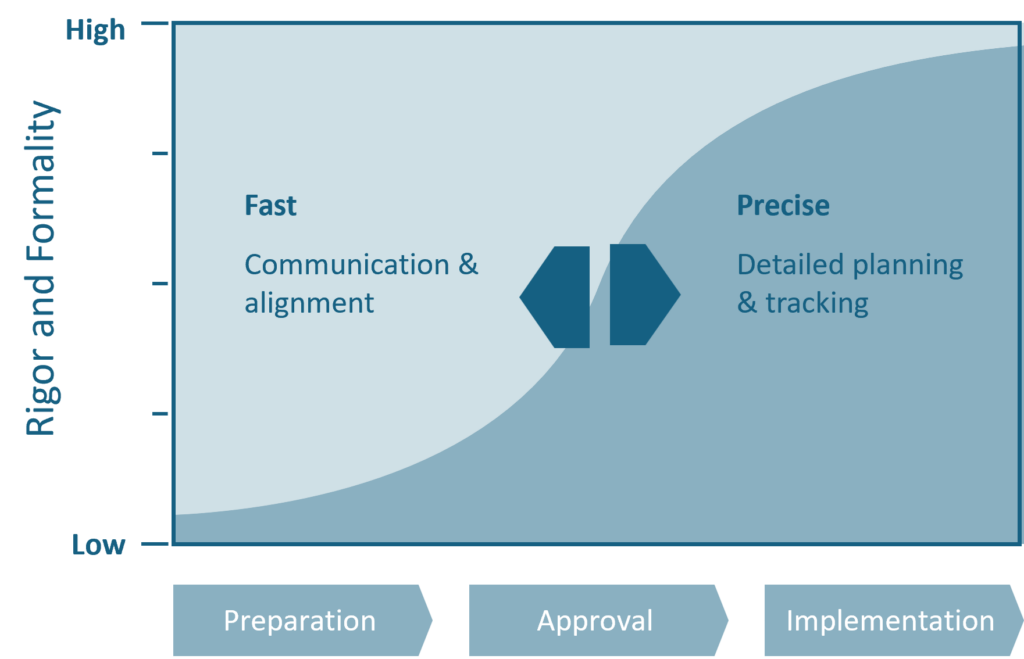
In the preparation phase, speed and effortlessness are paramount. It is used to create a first high-level version of the end-to-end description of the deliverables. Its main purpose is supporting the communication and alignment. On this basis, the high-level planning can take place.
Later on, it must be smoothly mutated into a more formal methodology and linked to external sources such as team backlogs or development level design models.
It is crucial that the IOM is frictionlessly expanded and provided with additional details in the coming phases. It must be avoided that the IOM or parts of it are tacitly discarded, and work continues on new basis.
“Flipchart Models” Need A Formal Representation
You should have a formal representation for the flipchart model in mind right from the start, for example in ArchiMate, UML or BPMN, as well as a suitable tool.
You should also think about a high-level structure right from the start in which you can store the graphic files neatly. There will be hundreds of them, including multiple versions of each image. A little later you should not only be able to store and retrieve the photos but also seamlessly translate them into formal notations including the package structure in the modelling tool.
The physical storage of the photos can be done with content management software or even with the selected modelling tool.
However, avoid interacting with your stakeholders via complex tools or notations during the preparation phase so as not to exclude anyone from the discussions.
